
DailyNo.274
Oct 13, 2026 Money Flow Digest: Korea, US, Japan

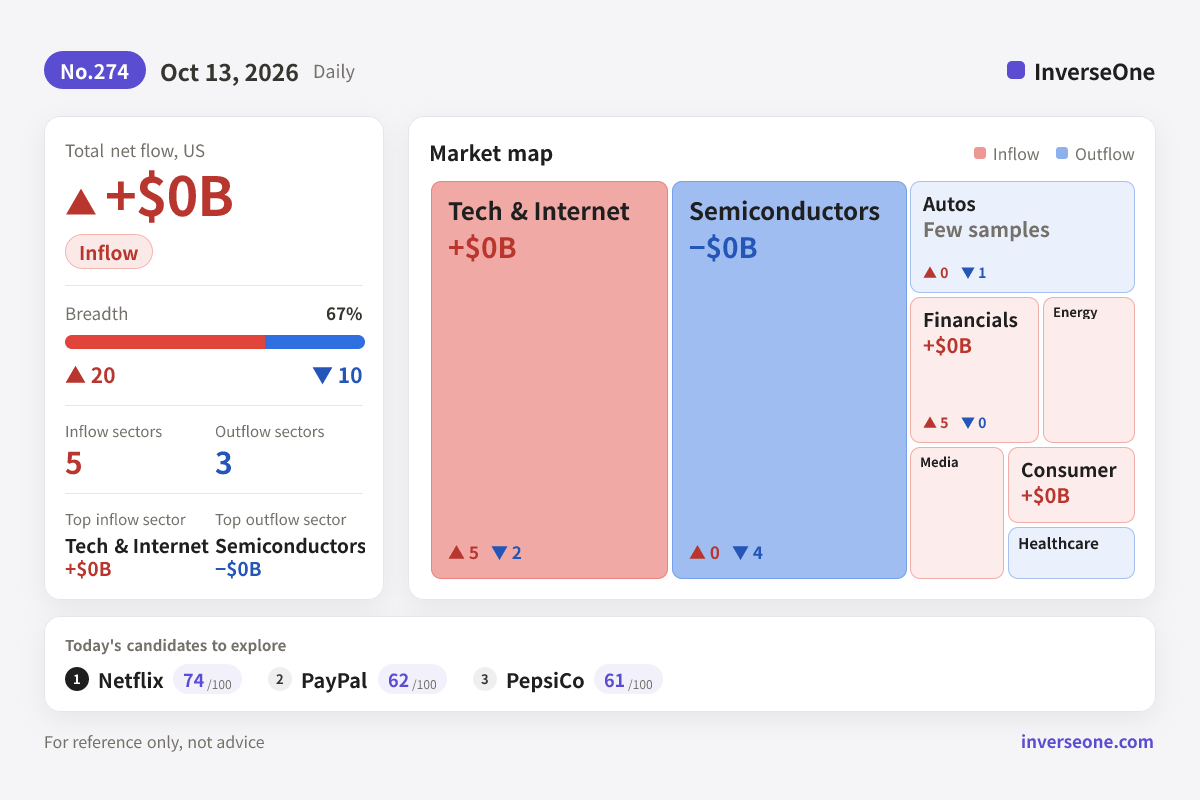
US market
US: 20 advancers vs 10 decliners. The largest net money flow was in Tech & Internet.
Sector money flow
- Tech & Internet▲5 ▼2+$0B
- Financials▲5 ▼0+$0B
- Energy▲1 ▼0-
- Healthcare▲1 ▼1-
- Autos▲0 ▼1-
- Semiconductors▲0 ▼4−$0B
US, net money flow is estimated from price and volume, sectors with fewer than 3 names hide the amount
Today's candidates to explore
Top match-score candidates from the US pool on this date. The score summarizes how many public-data signals overlap.
Korea market
Korea: 18 advancers vs 41 decliners. The largest net money flow was in Semiconductors.
Sector money flow
- Batteries▲5 ▼1+₩18B
- Materials▲4 ▼3+₩5B
- Energy▲1 ▼1-
- Healthcare▲2 ▼11−₩20B
- Tech & Internet▲0 ▼5−₩47B
- Semiconductors▲4 ▼4−₩175B
Korea, net money flow is estimated from price and volume, sectors with fewer than 3 names hide the amount
Today's candidates to explore
Top match-score candidates from the Korea pool on this date. The score summarizes how many public-data signals overlap.
- 1JYP Entertainmentvs 52w high -55%OversoldInflow indexMomentum +2.6%79/100+2.6%
- 2EcoPro BMvs 52w high -50%OversoldInflow indexMomentum +3.5%76/100+3.5%
- 3Lunitvs 52w high -77%OversoldInflow index76/100+1.8%
- 4Sam Chun Dang Pharmvs 52w high -80%OversoldInflow index73/100+1.0%
- 5People & Technologyvs 52w high -47%OversoldInflow indexMomentum +2.2%72/100+2.2%
Japan market
Japan: 17 advancers vs 12 decliners. The largest net money flow was in Tech & Internet.
Sector money flow
- Semiconductors▲2 ▼1+¥12B
- Media▲2 ▼0-
- Industrials▲5 ▼0+¥1B
- Financials▲1 ▼3−¥3B
- Consumer▲1 ▼1-
- Tech & Internet▲2 ▼2−¥19B
Japan, net money flow is estimated from price and volume, sectors with fewer than 3 names hide the amount
Today's candidates to explore
Top match-score candidates from the Japan pool on this date. The score summarizes how many public-data signals overlap.
DeepThought concept map
Chip Stocks Shaken by Both Oil and Interest Rates
Semiconductors appear in today's sector table. This map lays out, on a single page, the paths by which oil prices and interest rates reach chip stocks.
View larger on DeepThought →Data basis: 2026-10-13, For reference only, not advice