Market overview
Read ↓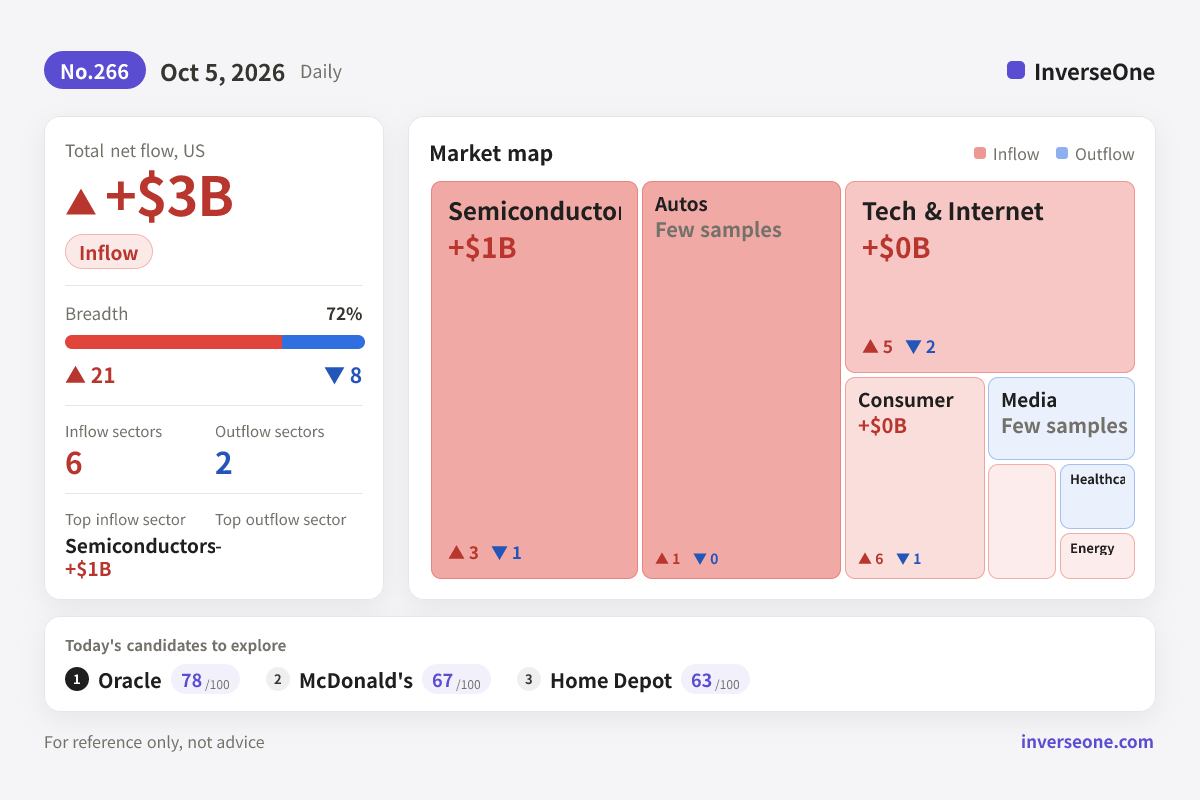
DailyNo.266Oct 2 close
Today's candidates to explore
Stocks where public price data conditions overlap, screened first
Total net flow+$2.5BMarket context ↓
Sorted by match score, not the probability of a price rise.Candidates screened by 52-week range, financial metrics, price change and volume conditions. The match score measures how many conditions overlap, not a probability of rising or validated predictive power.
- 1Oracle$142.30+3.06%35.3M$431.4B781. ORCL, Tech & Internet, Oversold, Inflow indexvs 52w high -56%Match 78
- 2McDonald's$231.89+0.03%6.4M$164.1B672. MCD, Consumer, Oversold, Inflow indexvs 52w high -32%Match 67
- 3Home Depot$282.85+0.14%4.8M$282.2B633. HD, Consumer, Oversold, Inflow indexvs 52w high -29%Match 63
- 4Broadcom$355.14+3.35%24.6M$1.7T634. AVGO, Semiconductors, Inflow index, Momentumvs 52w high -28%Match 63
- 5PepsiCo$125.89+0.23%6.1M$172B625. PEP, Consumer, Oversold, Inflow indexvs 52w high -27%Match 62
- 6Tesla$370.59+4.65%54.1M$1.5T616. TSLA, Autos, Inflow index, Momentumvs 52w high -26%Match 61
- 7Netflix$67.06-1.16%38.3M$279.2B577. NFLX, Media, Oversold, Above-pool volumevs 52w high -46%Match 57
- 8PayPal$52.80-0.49%9M$45.2B518. PYPL, Financials, Valuevs 52w high -33%Match 51
Use the star to save a stock. Open Watchlist to track its price since you saved it.
How to read the score
The match score marks how many conditions overlap on a 0 to 100 scale: the 52-week range, valuation metrics, price change and volume. It is not a probability of rising or a forecast return. A larger gap to the high also reflects a larger decline. It does not mean the stock will return to that high.
Guides- Sector comparison
- Tesla changed +4.65%. There are no other covered Autos stocks in US, so no sector comparison is available.
- Variables to watch
- EV demandTariffsRaw material prices
- Risks to check
- -26% below the high, the downtrend may continue
- Tariff burden
- Slowing EV demand
This compares price changes among covered stocks in the same market. It does not establish why prices moved. Variables and risks are sector reference lists.
The stories behind the numbers
Explore market moves, company businesses and investment theses.
Today's investing questionNew reportPublished 5 days ago
Stocks whose share counts rise through new issuance subsequently underperform the market.
There is an answer, checked against actual past prices. Pick your take first.
- Understand the marketDailyDaily digest of sector money flow and candidates
- Understand a company / AmazonIn the quarter Amazon's net income swelled to $62.6 billion, its trailing twelve-month free cash flow turned into a $7.6 billion outflow.
Discovery angles
Deep drop
Today's biggest decliners, weighted toward heavy turnover. Ranked by lowest change with a 30% tilt to trading value.
Value
Low-PER value candidates.
Near high
Strongest names near their 52-week high.
Stock news

How Supreme Court Battles Involving Apple, Exxon, and Intel Could Hit Your Portfolio
finance.yahoo.com

Accenture vs. Microsoft: Which Technology Stock Is a Better Buy in 2026?
fool.com
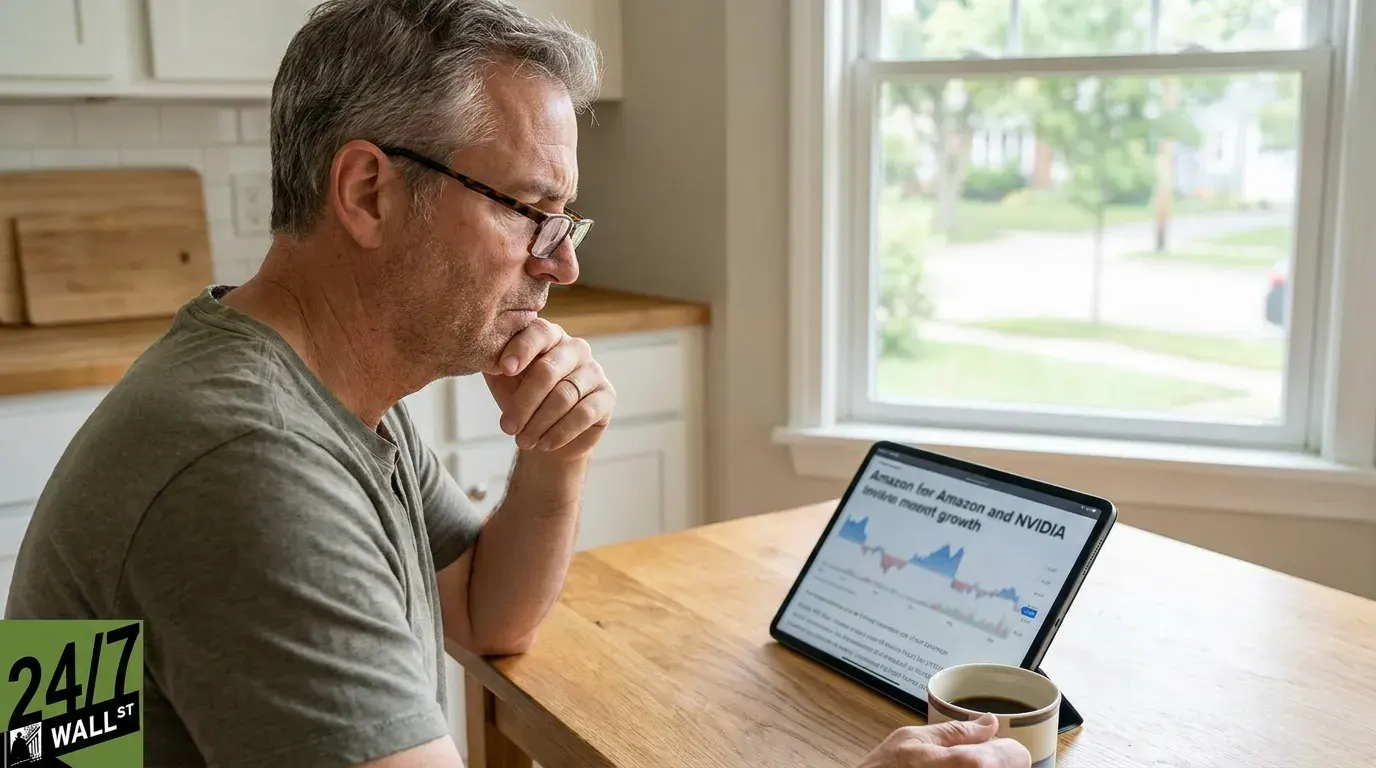
Amazon Wants to Move $8 Billion in Nvidia Chips Off Its Books. Is AI's Financing Model Starting to Change?
247wallst.com
Alphabet Reported Negative Free Cash Flow for the First Time Ever. Here's Why That Milestone Matters for Shareholders.
fool.com
Amazon AWS CEO reveals surprising risk to AI stocks and U.S. economy
thestreet.com
Better Artificial Intelligence Stock: Alphabet vs. Meta Platforms
fool.com
Tesla Delivered 22,141 More Vehicles Than It Built in Q3. Here's the Production Number That Decides What Comes Next
tikr.com
In 1978, A Nevada Man Nicknamed '40-Dollar Frank' First Bought Shares Of Berkshire Hathaway. Three Decades Later Frank Fitzgerald Gathered His Family On The Deck Of His New Dream Home To Say "Thank you, Warren."
247wallst.com
Then and now
Closing prices from 2026-08-06 placed next to today's. 30 stocks matched.
Average over the span +0.1%
Up the most
- AMD$485.20 → $633.91+30.6%
- Meta Platforms$584.60 → $728.08+24.5%
- Salesforce$190.84 → $234.69+23.0%
Down the most
- Home Depot$351.70 → $282.85-19.6%
- Broadcom$420.49 → $355.14-15.5%
- McDonald's$274.20 → $231.89-15.4%
Markets on screen
Films and documentaries about real market events. Each one comes with a concept to watch for and the scene where it shows up.
The Big Short2015, Film
Based on the investors who saw the 2008 subprime collapse coming.
Credit default swap: Michael Burry goes to the banks and asks to buy contracts that pay out if mortgage bonds go bad.
Margin Call2011, Film
One night inside an investment bank on the eve of the crisis.
Leverage: The firm learns that a 25% drop in the bonds on its books would cost more than its entire market cap, and sells them off the next morning.
Inside Job2010, Documentary
A documentary tracing the causes of the 2008 crisis.
Rating agency conflicts of interest: Agencies paid by the banks that issued the bonds give CDOs top ratings, and their executives call ratings mere opinions.
Default2018, Film
A drama set in the week before Korea's 1997 currency crisis.
Currency crisis: Yoon Jung-hak buys up dollars, while Gap-su, paid in promissory notes for supplying a department store, faces bankruptcy when the store defaults.
The Wolf of Wall Street2013, Film
Based on the true story of a 1990s Wall Street broker.
Penny stocks: Belfort sells over-the-counter penny stocks by phone and takes half of each sale as commission.
Total net flow
+$2.5B
For each covered stock, we calculate (change % ÷ 100) × price × volume, then add the results. This estimate is not measured investor net buying and covers only the stocks shown here.
- Inflow sectors
- 6
- Outflow sectors
- 2
- Lead sector
- Semiconductors 39%
- Near high
- 3
Market map
(8)Tile size = flow size, color = inflow (red) / outflow (blue)
Flow index by sector(8)
- Semiconductors+$1B3/139%
- AutosFew samples1/036%
- Tech & Internet+$467.5M5/218%
- Consumer+$123.6M6/15%
- Financials+$10.4M3/20%
- EnergyFew samples1/00%
- HealthcareFew samples1/10%
- MediaFew samples1/11%
Newly published research
- AmazonAMZNNewIn the quarter Amazon's net income swelled to $62.6 billion, its trailing twelve-month free cash flow turned into a $7.6 billion outflow.researched 12 days ago, 4 charts
- WalmartWMTWalmart U.S. eCommerce sales rose about $5.7 billion on the year in the second quarter, more than the segment's entire $4.3 billion increase in net sales.researched 18 days ago, 5 charts
- NetflixNFLXNetflix bought back $4.71 billion of its own stock in the second quarter, its largest quarter of repurchases, while free cash flow over the same three months came to $1.53 billion.researched 20 days ago, 4 charts
These figures are reference estimates built from price and volume: a starting point for narrowing down ideas, not a buy or sell signal.